2D Hard Rock Seismic Interpretation:
A Case Study of Everleigh Well, Western Australia.
Iceni Gold (ASX:ICL) recently reported results of their 2D seismic work completed at Everleigh Well near Laverton in Western Australia. Rock Solid Seismic played a significant role in this project by producing the geological model forming the interpretation deliverable. The model has been successfully tested with subsequent exploration activities.
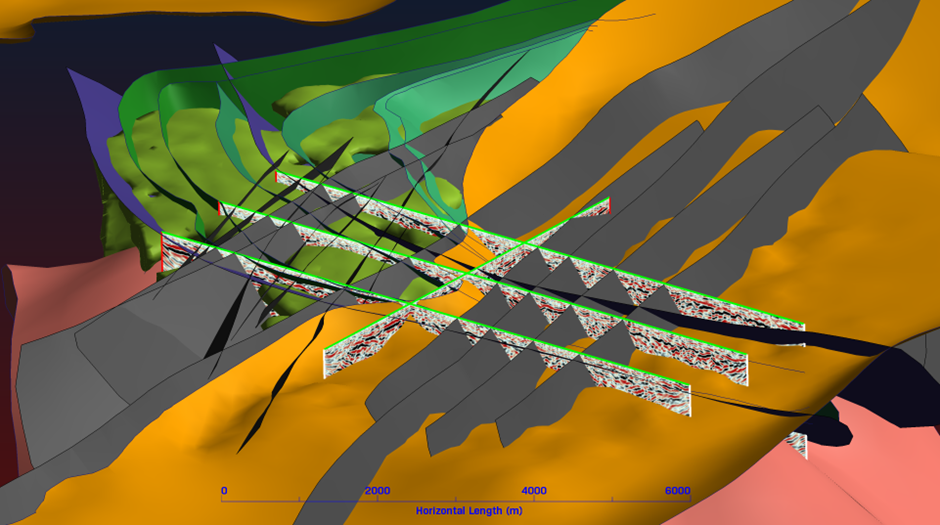
Figure 1: Geological Model (2D Seismic Interpretation)
This project demonstrates the value of systematically incorporating all available data into a cohesive geological model which can be utilised as the basis of an exploration strategy. Where once we may have chosen to use a magnetic interpretation or a mapping interpretation or a gravity inversion model or a cross section based on drilling data to further our exploration program, we now have the ability to integrate all of those data sources and apply some geological smarts to inform exploration strategies.
Reflection seismic data can help complete the picture by delivering information in the third dimension with greater resolution than other geophysical methods.
However, it’s a mistake to think of seismic data as a silver bullet that can be used to unlock the project geology without also using the other data available to us. This is especially true for 2D seismic data: 2D seismic data is imaging a 3D subsurface, so an interpretation of the reflection seismic data can really only be valid when information from the other dimensions is accounted for. This realisation drives the concept of wholistic interpretation of all data, delivering a 3D geological model as the interpretation of 2D seismic data.
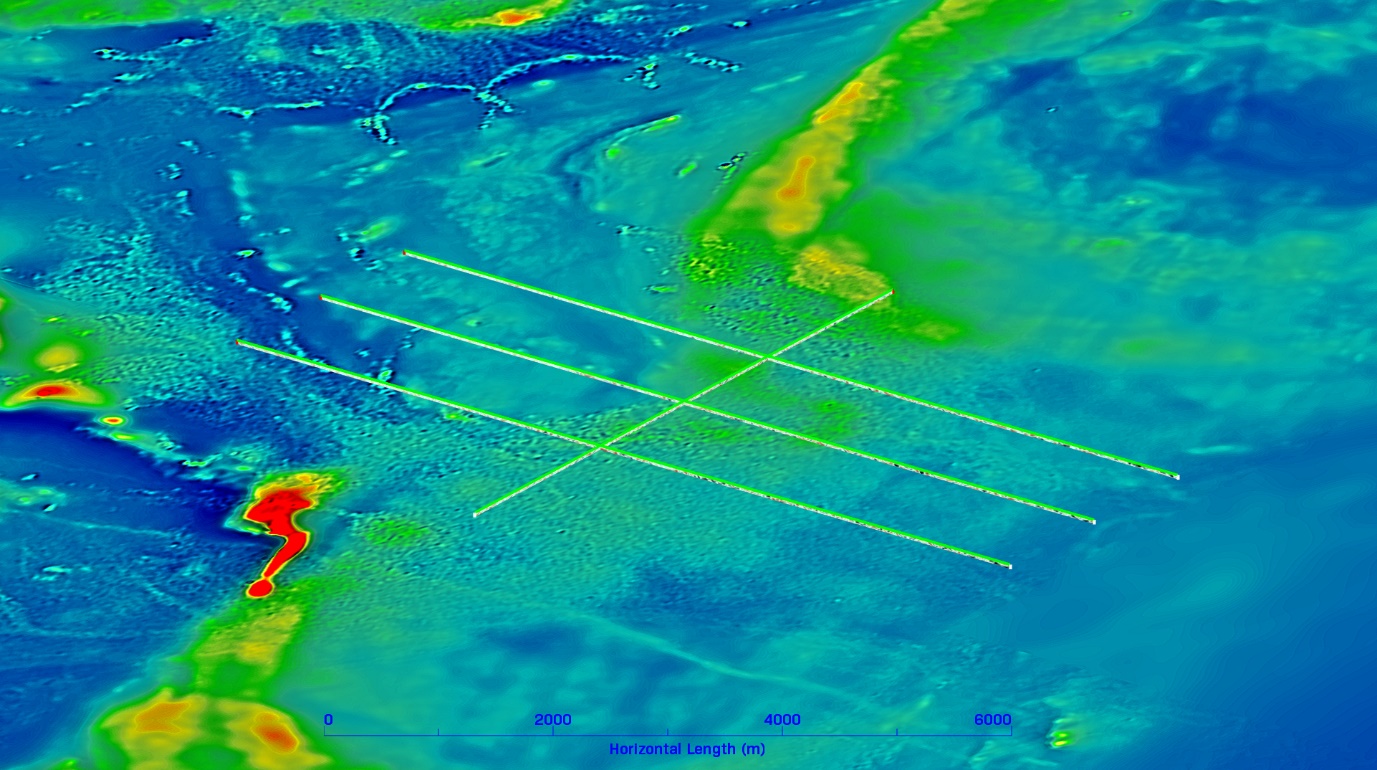
Figure 2: Location of Magnetics and Seismic Data
The Everleigh Well project is a prime example of how all available data is used to generate an exploration model. In this project, four 2D seismic lines were acquired over an area that had pre-existing magnetic, gravity, drilling, mapping and geochemistry data. Magnetic data offers a broad scale data set interrogating the near surface geology (<400 m depth) and the gravity data offers somewhat deeper information, albeit at lower resolution.
Mapping, radiometrics and soil geochemistry offer surficial observations, while drilling offers deeper observation data from quite restricted locations.
In isolation:
The seismic data was ambiguous: Reflectors could be either lithological or structural in nature.
The gravity data could not be well constrained in an inversion model without the tomographic velocity model
The magnetic susceptibility data showed the mapped granite to have a higher mag sus than the mafics nearby, confusing the interpretation of the magnetics and the granites.
Magnetics are very noisy where alluvial overburden exists due to maghemite in the transported material.
Mapping outcrop and drilling data lacks context.
The Everleigh Well project is a prime example of how all available data is used to generate an exploration model. In this project, four 2D seismic lines were acquired over an area that had pre-existing magnetic, gravity, drilling, mapping and geochemistry data. Magnetic data offers a broad scale data set interrogating the near surface geology (<400 m depth) and the gravity data offers somewhat deeper information, albeit at lower resolution.
Mapping, radiometrics and soil geochemistry offer surficial observations, while drilling offers deeper observation data from quite restricted locations.
In isolation:
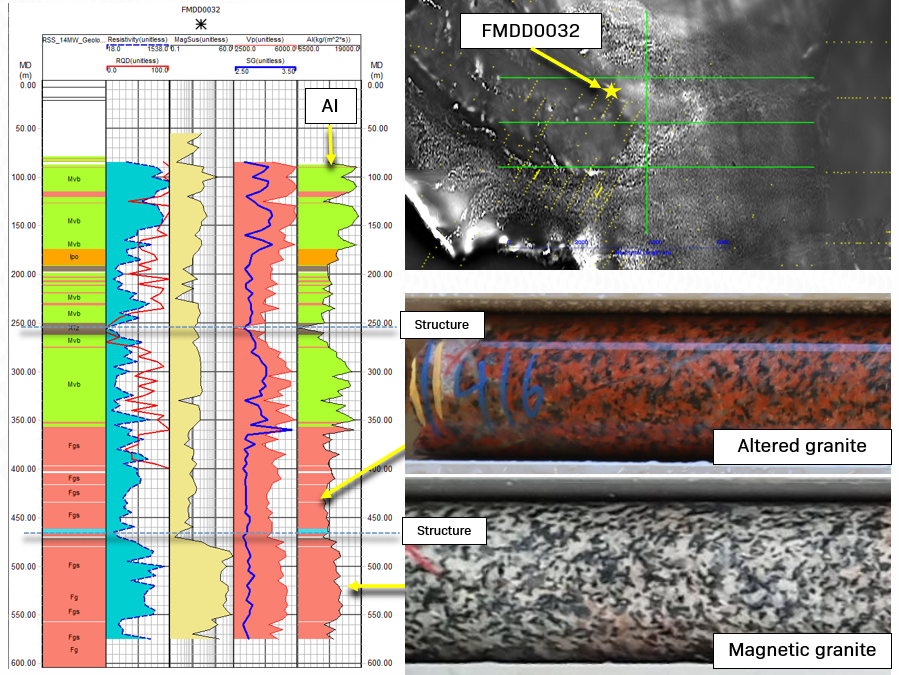
Figure 3: Results of Petrophysics Study
Petrophysics acquired on FMDD0032 revealed:
The granite has two distinct AI values correlating with alteration of the granite. Altered granite has a lower velocity than the magnetic granite.
The structural contact has enough AI contrast to return seismic energy (i.e. the contact is a reflector.)
Altered granite has a lower AI and density than the mafic rocks.
Shear zones are reflectors.
When the gravity inversion is overlaid on the seismic data, structures seen in the seismic are defining deep-seated shears separating units of differing density. These structures correlate with observed features in the magnetic data, allowing the construction of a 3D surface representing that feature extending well beyond the extents of the seismic survey.
When the gravity inversion is overlaid on the seismic data, structures seen in the seismic are defining deep-seated shears separating units of differing density. These structures correlate with observed features in the magnetic data, allowing the construction of a 3D surface representing that feature extending well beyond the extents of the seismic survey.
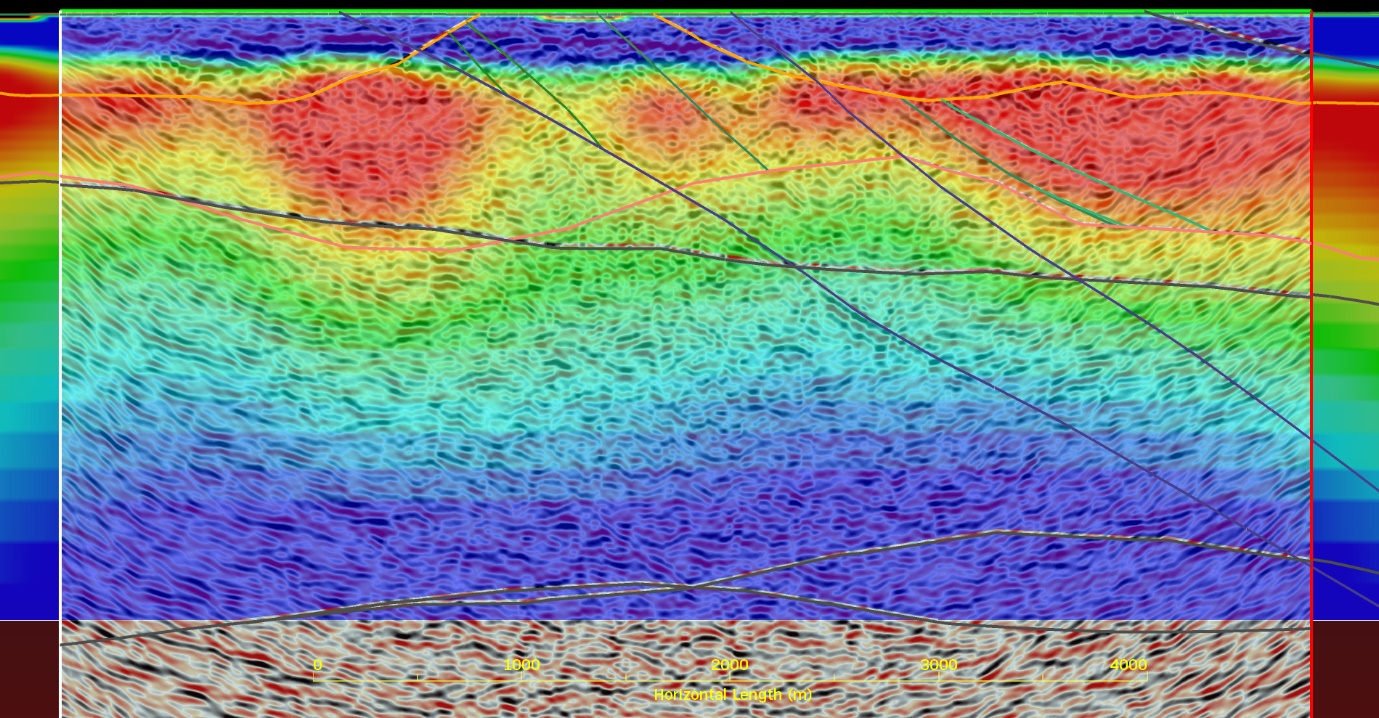
Figure 4: Gravity Inversion Model Overlain on 2D Seismic Data
Inferences can be made about the lithology between the various structures based on their magnetic and density values.
A tomographic velocity model was produced from the 2D seismic data (velocity is a proxy for hardness), from which a TOFR (top of fresh rock) surface was derived and calibrated against drilling information. The TOFR was supplied to Southern Geoscience Consultants to constrain a new gravity inversion model.
The geometry of the major granitic intrusive can be gleaned from the revised gravity inversion model and seismic data, even though the contact between the granite and the underlying mafic units is not readily apparent in the seismic data. (It’s a shallow “surf board” shape here.)
Most importantly, the shears modelled with both the 2D seismic and magnetic data spatially correlate with instances of mapped gold mineralisation (detector work) and old workings.
The 3D geological model produced by Rock Solid Seismic using all of these data sets gives Iceni Gold the ability to explore the project area with confidence. To date, the model is holding up well to further scrutiny. Drilling, mapping and other works continue to deliver evidence of mineralisation in locations where the model predicts it to be.
In this case, acquiring and interpreting 2D reflection seismic data was money well spent by Iceni Gold.


